
Click image to enlarge
To start, volatility in the stock market has been higher in recent years, and so has economic volatility. We had a 100-year event due to COVID-19 and the government stimulus, which caused a terrible recession and then a snapback to growth because of the stimulus. And now, another recession is very possible. Some individuals are under unusual financial stress. The thing to do if you are frightened is to talk about it with a knowledgeable professional. 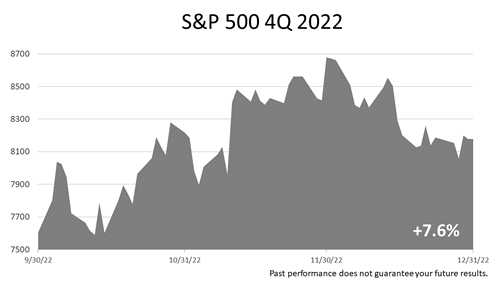
Click image to enlarge
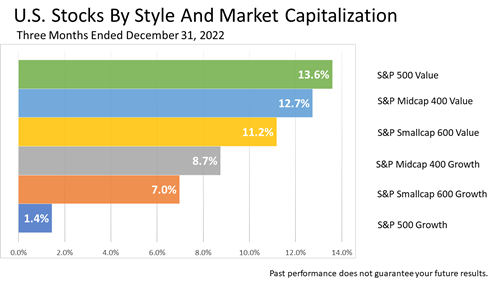
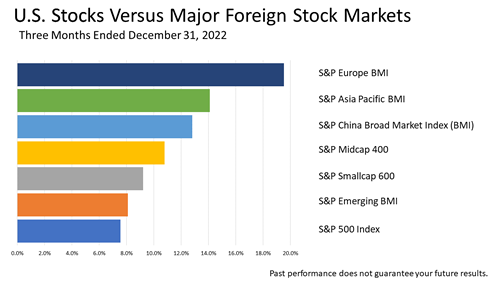
Stocks posted a strong gain in the fourth quarter of 2022, following three consecutive losing quarters. 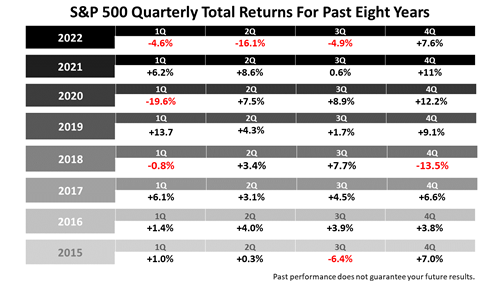
Click image to enlarge
Here’s one way of putting the last quarter’s performance in perspective. It’s a look at the returns in 32 quarters—eight years—in the Standard & Poor’s 500 Index. What stands out is that the first three quarters of 2022 were pretty lousy. What’s less obvious is that volatility has increased in recent years. These return numbers are based on the Standard & Poor’s 500 Index, which holds the 500 largest publicly investable companies in the United States. The S&P 500 Index does not own equal positions in the 500 companies. Rather, the index is market-weighted, which means that companies like Apple, Amazon, and Microsoft dominate the performance of the index. The average annual return on the index in modern history, starting in the 1950s, is about 10% annually. So, the 7.6% return in the fourth quarter. However, the story of these past eight years has been that stocks have only occasionally shown a quarterly return around 2.5%. Point is, volatility increased in recent years, and stock investing since the pandemic has been an emotional roller coaster. 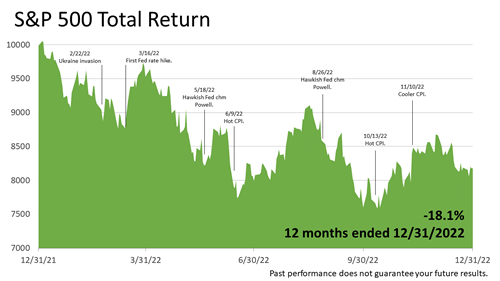
Click image to enlarge
Here’s additional perspective on what’s been happening with stocks. This chart more clearly shows the evolution of the bear market in stocks which began on June 13, 2022. June 13 was the day the S&P 500 dropped more than 20% from its January 3, 2022, all-time high for the first time. To be clear, this chart shows the value of the S&P 500 for the four quarters in 2022. In the upper left is the beginning of 2022. The S&P 500 hit an all-time high on January 3rd. Then, on February 23, Russia invaded Ukraine. Just six weeks later, in mid-March, the U.S. central bank raised the cost of lending money to fight inflation. But central bankers had made a mistake. They took too long to act on inflation and have been playing catch-up since the first rate hike on March 16. Inflation erodes consumer buying power. Consumers are the lifeblood of America’s economy. Inflation could devastate even the world’s most powerful economy. It’s like kryptonite for a consumer-driven economy. Inflation is lower now and trending in the right direction, but the threat continues to cloud the outlook for growth in 2023. 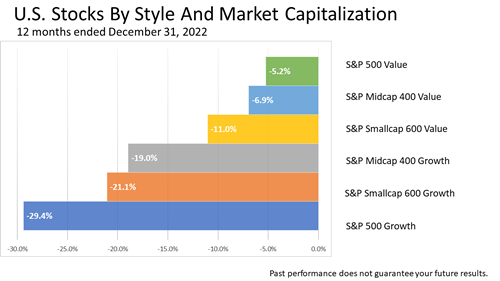
Click image to enlarge
​ As I mentioned in the very first chart, the S&P 500 is a market-weighted index and heavily influenced by the largest companies in the index. The largest companies in the S&P 500 tanked in 2022. Apple, Microsoft, and Amazon experienced stock price drops of more than 40%! This is why the S&P 500 Growth index declined 29.4% in the past 12 months ended December 31, 2022. Meanwhile, please note that the S&P 500 Value index declined by 5.2%. The super-capitalization growth companies that soared the most since the pandemic experienced a battering. Let’s now take a moment to talk about what all this means in the context of a strategy for managing a retirement income portfolio or a portfolio for building wealth for the next generation. 
Click image to enlarge
We give investment advice predicated on modern portfolio theory. MPT is a large body of financial knowledge based on academic research done over the last 70 years. This framework for investing is now taught in the world’s best business schools and embraced by institutional investors. 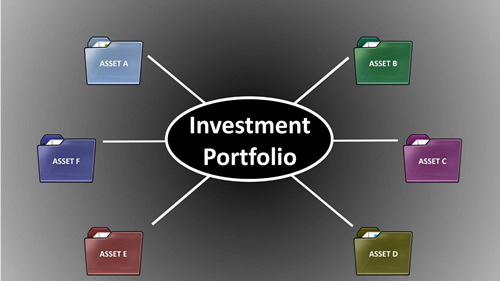
Click image to enlarge
To reduce MPT down to basics, MPT is a way of limiting the risk of losing money for investments you commit to holding until you die, or for at least a couple of decades. The world that investments revolve around is always changing, and not enough statistical history exists to make investment predictions with certainty. MPT is a framework for managing that risk. 
Click image to enlarge
MPT is a quantitative approach to financial, economic, and statistical facts. MPT adjusts what’s happened in the past to come up with an investment outlook based on economic fundamentals. MPT does not guarantee success, but its logic is embraced by pension funds and other institutional investors. In addition to classifying investments based on their distinct statistical characteristics, MPT imposes a quantitative discipline for managing assets based on history and fundamental facts about finance. On top of the statistical knowledge about how assets behave based on MPT, a layer of knowledge of history and experience is added. That layer is professional judgment, and it’s a distinguishing characteristic of this firm. 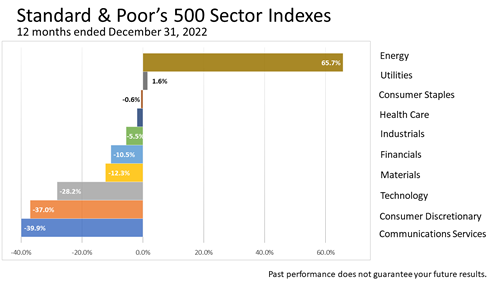
Click image to enlarge
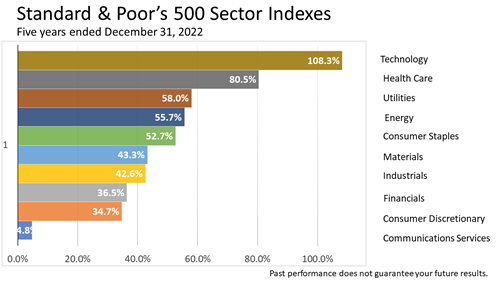
Here are 12-month industry sector returns for the 12 months of 2022. Energy was one of only two sectors in the period with a positive return, and it was about 40 times greater than the other gainer, utilities. 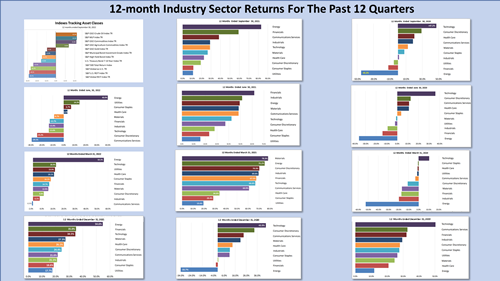
Click image to enlarge
Now, here are 12-month industry sector returns for the 12 quarters preceding the fourth quarter of 2022. They show why it is so difficult to predict markets. Each snapshot shows 12-month returns on the 10 industry sectors comprising the Standard & Poor’s 500 Index. The way to read this set of charts is by starting with the third quarter of 2022, in the upper left, and reading down to see the previous quarter. The 12-month returns are shown going back to the last quarter of 2019. What stands out is that energy industry stocks have been the top-performing industry sector for the past five quarters, but were the worst performers for five quarters in a row starting with the final quarter of 2019. To capture the large gains on energy shares in the four quarters, you would have had to hold on to energy stocks through the dog days of 2020, when energy share prices plunged during the COVID-19 partial shutdown of the economy. COVID was a 100-year risk and totally unexpected. No one predicted it! This is important evidence of how unpredictable the future of markets always is. Going through this bit of history may help you stay focused on a strategic investment plan. Instead of chasing dreams, please consider the strategy we use—modern portfolio theory—as a framework for portfolio management. 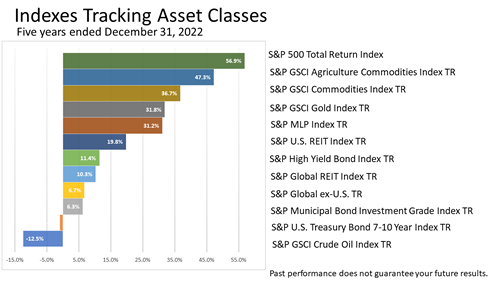
Click image to enlarge
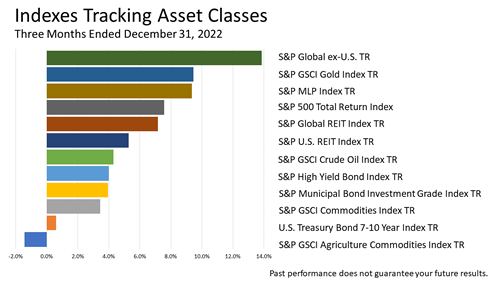
Over five years, which is approaching a long-term holding period and has included two bear markets, crude oil was at the bottom of this chart tracking asset classes, while the S&P 500 was atop the list. 
Click image to enlarge
U.S. central bankers are likely to be criticized by historians for not taking inflation seriously sooner, but the Federal Open Market Committee’s (FOMC) aggressive policy begun in March 2022 is working, data released Friday morning show. The progress of the United States, despite political discord in Washington, D.C., is notable. The post-pandemic inflation crisis has been managed well enough by the Federal Reserve System to require planning for the next expansion cycle! This is a good new problem to have. 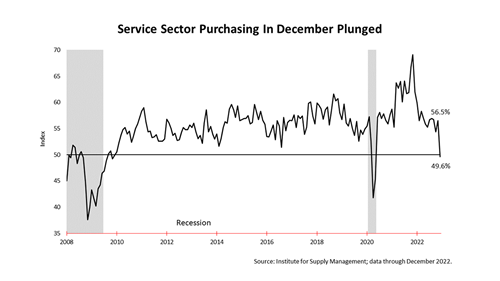
Click image to enlarge
After 10 months and perhaps the harshest monetary tightening in U.S. history, the economy evidenced sure signs of slowing in December, according to data released Friday. Purchases in the service sector cratered in December. In addition, for the one-year period ended November 30, 2022, the appalling annualized inflation rate soared in the first seven months to 10.6% but slowed to a mere 2.5% in the last five months of the period, economist Alan Blinder said in a Jan. 6, 2023, column in The Wall Street Journal. To be clear, the Federal Reserve target of 2% inflation is not far off. 
Click image to enlarge
With the investment outlook uncertain, as it is almost always, this chart is a reminder that crises have come and gone throughout modern history, and $1 invested in the U.S stock market, as measured by the Standard & Poor’s 500 stock index, compounded at an annualized rate of 7% for 65 years ended December 31, 2022. While the stock market’s unpredictable in the near term, don’t let it be a distraction from another important wealth building topic: A smart thing to do at this moment is to determine how to take advantage of the newly enacted SECURE Act 2.0 in 2023. This new reform to retirement tax law affects Americans of all income and age groups. The new law, commonly called SECURE 2.0, was actually titled by Congress the “Securing a Strong Retirement Act 2.0.” SECURE 2.0 expands on the Setting Every Community Up for Retirement Enhancement (SECURE) Act signed by President Donald Trump in December 2019. SECURE 2.0 is part of a massive government spending bill, the $1.7 trillion Consolidated Appropriations Act of 2023.
The 4,155-page bill funds the federal government through September 30, 2023, and contains provisions addressing numerous national financial priorities, such as aid to Ukraine and funding federal disaster relief, as well as retirement funding. Some of the new rules on retirement became effective as of January 1st, 2023, while others will not kick in for many years. In a complex world, this article is not advice but presents facts, analysis, and uncommon financial knowledge for education purposes. If you are interested in our tax planning education for clients about SECURE 2.0, please let us know and we will send you an in-depth summary of the tax and financial planning implications of this game-changing revision to IRAs and employer retirement plans. 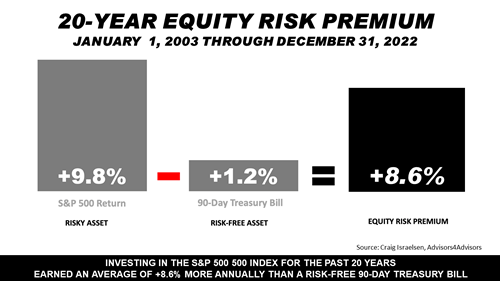
Click image to enlarge
If you are unhappy that the bear market is now in its eighth month and that stocks are about 17% lower than their previous high, remember the great paradox of long-term investing: Putting up with periodic losses has been a good investment for decades for retirement portfolios and those building wealth for the next generation. The equity risk premium illustrated here shows the reward received annually for tolerating the risk of owning stocks versus owning a risk-free investment. Stocks, as measured by the Standard & Poor’s 500, averaged a 9.8% annual return in the past 20 years—more than seven times the 1.2% annualized return on risk-free 90-day U.S. Treasury bills. Subtracting the average annual return on T-bills from the return on stocks, the resulting 8.6% is the premium stock investors annually were paid for taking the risk of owning U.S. stocks over the past 20 years. 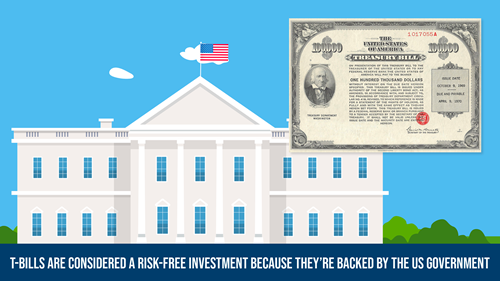
Click image to enlarge
To be clear, T-bills are considered a risk-free investment because they’re backed by the full faith and credit of the United States government. In contrast, stock market investments are not guaranteed. Stock prices fluctuate depending on the economy and investor sentiment, which periodically subjects stocks to unpredictable drops. In fact, if all 500 companies in the S&P 500 index were to go bust, an investment in a fund mimicking the blue-chip index could be totally lost. In addition, there’s no guarantee that the strong performance of stocks will be repeated in the future. While bear market in stocks losses are hard to tolerate, remember that precisely because stocks are a risky investment, they have paid a significant premium over a riskless investment. 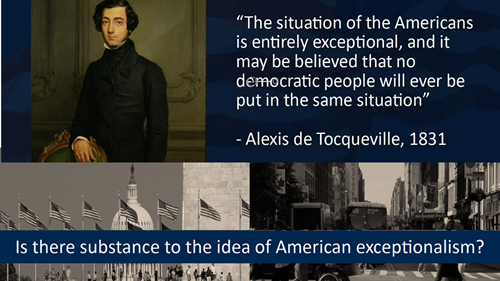
Click image to enlarge
American exceptionalism is a phrase coined 180 years ago by French historian Alexis de Tocqueville to describe what makes our democracy great. Today, it is a colloquialism used to describe America’s unique values, resources, and historical development, as well as its system of government. But is there more to this patriotic slogan than meets the eye? 
Click image to enlarge
The validity of American exceptionalism is of much more than mere academic interest. It’s an investment question. We are pleased to share evidence that American exceptionalism is indeed a sound belief manifested every day in news headlines, but it is easily missed in the busyness of 21st century life and a mind-numbing stream of news and information. 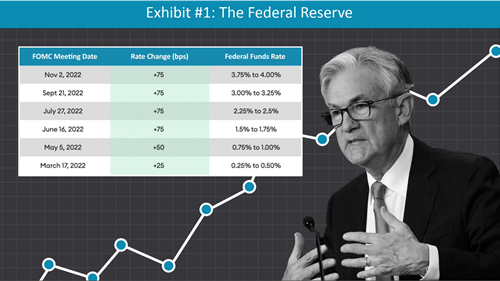
Click image to enlarge
The battle waged by the U.S. central bank against inflation since March 2022 exhibits the remarkable strength of the Federal Reserve System. The Fed, a uniquely American construct of Alexander Hamilton, was enacted into law 15 years after the birth of the U.S. 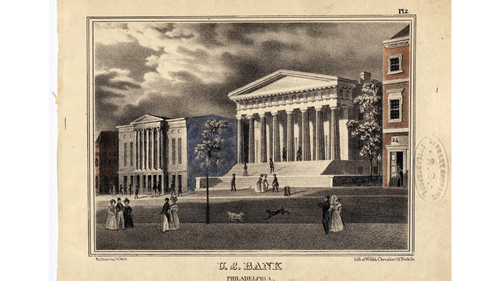
Click image to enlarge
The young democracy Tocqueville praised in 1835 created the nation’s first central bank, which repeatedly has been reinvented, revised, and modernized to keep up with changes in the economy, technology, and communications. 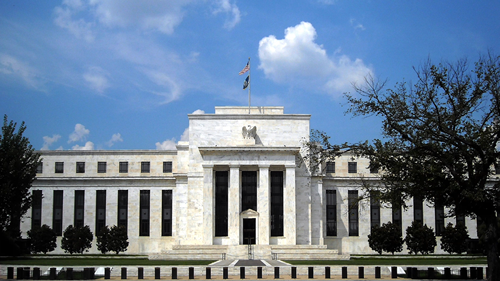
Click image to enlarge
Today, the Federal Reserve’s Federal Open Market Committee (FOMC) conducts itself with a level of transparency unthinkable just three decades ago. Until 1994, the FOMC did not issue a policy statement until weeks after its meetings, forcing investors to closely monitor the activities of the Fed’s open market trading desk in hopes of determining if the Fed was adjusting monetary policy. 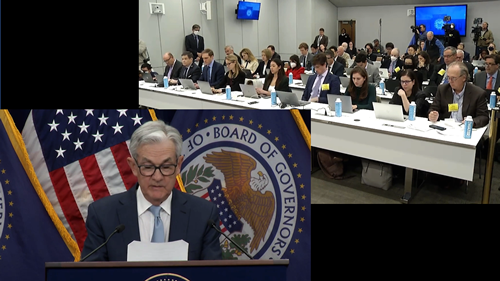
Click image to enlarge
Today, the FOMC issues not only a lengthy policy statement after each of its eight scheduled meetings, but interest-rate policymakers release minutes and quarterly projections made by each FOMC member at every meeting. And the Fed chair announces policy decisions and takes questions from the world financial press in a live-streamed event following every FOMC meeting. For the largest economy in the world to be able to respond to inflation, which has destroyed many of the world’s empires in the past, demonstrates why Tocqueville called it American exceptionalism. 
Click image to enlarge
Only in 1977, after the U.S. experienced ruinous inflation for over a decade, did Congress modify federal law governing the Federal Reserve’s mandate, which enabled then-chair Paul Volcker to put an end to the Great Inflation of 1965 to 1982. The Federal Reserve Reform Act of 1977 revised the central bank’s mandate by explicitly directing it to promote maximum employment and stable prices as co-equal goals. 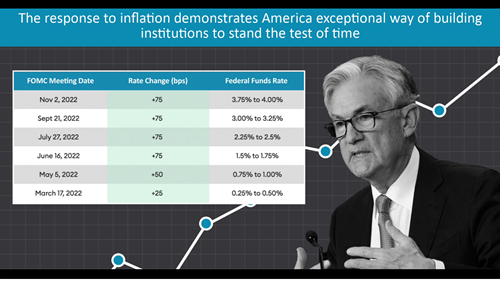
Click image to enlarge
Moreover, the Fed has tamed inflation in 2022 while the U.S. imposed economic sanctions on Russia for its lawless invasion of Ukraine, which threatens the rules-based order imposed by the U.S. that has kept Europe free of war since the end of World War II in 1945. 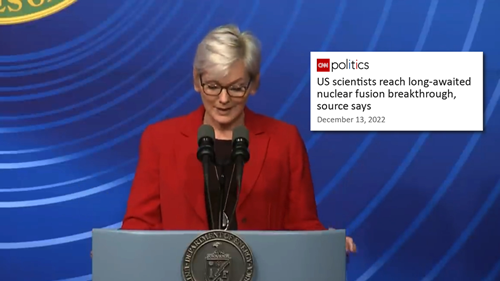
Click image to enlarge
While the Federal Reserve demonstrated its exceptional qualities in 2022, the U.S. Department of Energy in December announced a major scientific breakthrough in fusion ignition on Monday that paves the way for major advancements in clean power as well as national defense. The world-changing scientific achievement required a commitment of billions in taxpayer funding for seven decades. 
Click image to enlarge
“No other great power is better placed to build the necessary partnerships and lead the way in tackling the major problems of the twenty-first century,” G. John Ikenberry, the world’s leading scholar of the rules-based U.S.-led world order, wrote in the December 2022 issue of Foreign Affairs. 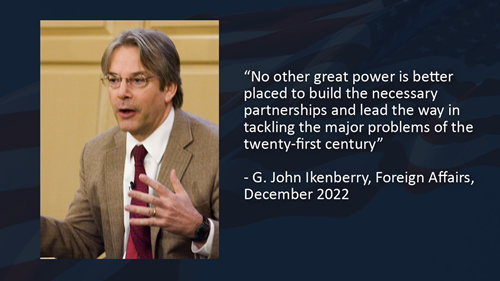
Click image to enlarge
“That China is ramping up pressure on Taiwan and that Russia sought to yoke Ukraine to its sphere of influence does not suggest American decline or the collapse of liberal order,” according to Prof. Ikenberry. “On the contrary, the crises exist because Taiwanese and Ukrainian societies want to be part of a global liberal system.” 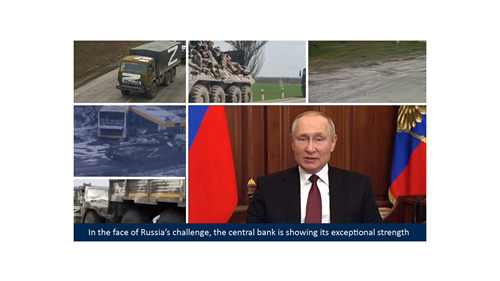
Click image to enlarge
Fighting to support a world order spreading freedom and transparency, the government of the United States made a good decision to invest in fusion research for decades, while simultaneously leading the world in creating the internet and managing the web’s good and bad effects in an open society. 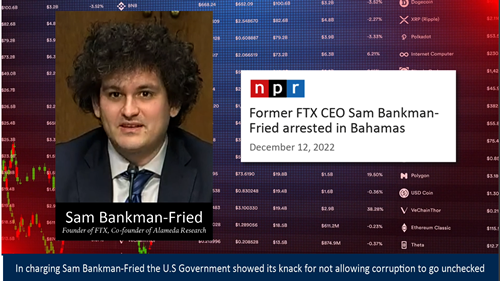
Click image to enlarge
Which brings up yet another way American exceptionalism revealed itself in the fourth quarter: In charging cryptocurrency king Sam Bankman-Fried with masterminding a criminal conspiracy and discrediting the cryptocurrency craze, the U.S government showed its knack for correcting its mistakes. 
Click image to enlarge
“The global order the United States has built since the end of World War II is best seen not as an empire but as a world system,” according to Prof. Ikenberry’s article, aptly titled “Why American Power Endures.” “A sprawling, multifaceted political formation, rich in vicissitudes, that creates opportunity for people across the planet.” 
Click image to enlarge

Click image to enlarge
Click image to enlarge
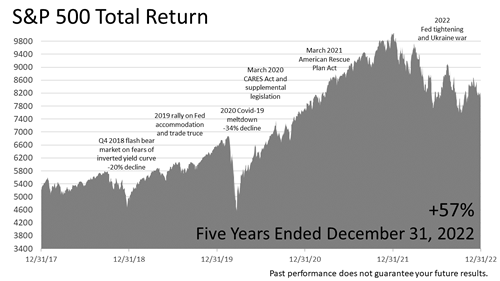
After trading sideways for approximately two years in 2015 and most of 2016 (not without hitting two air pockets during that period) the stock market broke out of that range post- the November 2016 election and rose steadily to an all-time peak on September 20, 2018, whereupon it dove by -20% on investors’ fears that an inverted yield curve was imminent. On January 4, 2019, the Fed signaled rates were on hold, whereupon stocks rallied for most of the remainder of 2019. In February of 2020, stocks hit a new all-time peak, whereupon the COVID-19 virus put the economy and the stock market into meltdown. By early September of 2020, stocks hit a record all-time high following the enactment of the CARES Act and related legislation. After a pause, stocks rallied steadily from the November 2020 election through year-end. Stocks continued upward through the first quarter of 2021 with the March enactment of the $1.9 trillion American Rescue Plan Act; and, despite the Omicron COVID variant, through the end of 2021. Stocks turned down in the first quarter of 2022 on Fed tightening and Russia’s invasion of Ukraine, and continued lower through the second and third quarters of 2022, and rallied modestly in the fourth quarter of 2022. Over the last five years, including dividends, the S&P 500 Total Return index has gained +57%. 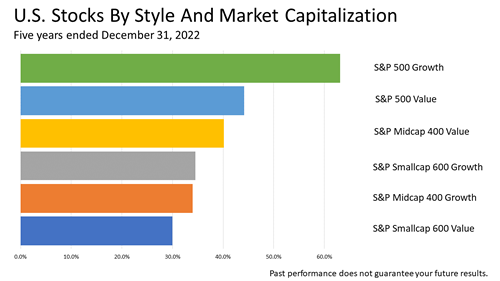
Click image to enlarge
Click image to enlarge

Click image to enlarge
Click image to enlarge
Click image to enlarge
Click image to enlarge
Click image to enlarge
|